Company Ownership Structure Data
Verified intelligence on corporate structures and group entities worldwide.
Ownership structures represent over 11% of the 360 million active businesses worldwide, with more than 41 million companies belonging to corporate groups. These include around 9.5 million in Europe, 4.5 million in North America, and 19.9 million in Asia. Access reliable, structured ownership data or purchase verified company ownership records in bulk to power compliance, research, and growth.
| Company Name | Country | City | Address 1 | State/Province | Postal Code | Website | Founding Year | Yearly Revenue in U.S. Dollars | Employees Total | Business Legal Type - Description | Number of Companies in Group | Company Registration Number | |
|---|---|---|---|---|---|---|---|---|---|---|---|---|---|
| 1 | Ongc Nile Ganga B.V. | Netherlands | Amsterdam | Strawinskylaan 725 Wtc Twr B 7th F | Noord-holland | 1077 XX | ongcvidesh.***** | 1995 | $621,889,000 | 23 | Corporation | 99999 | 24259746 |
| 2 | Ongc Nile Ganga (san Cristobal) B.V. | Netherlands | Amsterdam | Strawinskylaan 725 Wtc Tower B, 7t | Noord-holland | 1077 XX | ongcvidesh.***** | 2008 | $621,889,000 | 2 | Corporation | 99999 | 34296177 |
| 3 | State Bank Of India (UK) LIMITED | Unitedkingdom | Moorgate | 15-17 King Street | London | EC2V 8EA | sbiuk.***** | 2016 | $129,069,858 | 285 | Corporation | 99999 | 10436460 |
| 4 | Indoil Global B.V. | Netherlands | Amsterdam | De Entree 252 | Noord-holland | 1101 EE | iocl.***** | 2014 | $94,626,873 | 2 | Corporation | 99999 | 60092939 |
| 5 | Punjab National Bank (international) LIMITED | Unitedkingdom | Moorgate | 1-5 Moorgate | London | EC2R 6JH | pnbindia.***** | 2006 | $81,777,000 | 188 | Corporation | 99999 | 05781326 |
| 6 | India Infrastructure Finance Company (UK) LIMITED | Unitedkingdom | Moorgate | 72 King William Street | London | EC4N 7HR | iifc.***** | 2008 | $55,671,189 | 3 | Corporation | 99999 | 06496661 |
| 7 | Nord Imperial, OOO | Russia | Tomsk | D. 51a Str. 15, Prospekt Kirova | Tomskaya Oblast' | 634041 | N/A | 2004 | $34,291,178 | 429 | Corporation | 99999 | 73738311 |
| 8 | Union Bank Of India (UK) LIMITED | Unitedkingdom | Moorgate | 12 Arthur Street | London | EC4R 9AB | unionbankofindiauk.***** | 2011 | $33,465,000 | 42 | Corporation | 99999 | 07653660 |
| 9 | State Bank Of India (california) | USA | Los Angeles | 707 Wilshire Blvd Ste 2900 | Los Angeles | 90017 | sbical.***** | 1982 | $32,875,000 | 73 | Corporation | 99999 | 1109378 |
| 10 | Bank Of Baroda (UK) LIMITED | Unitedkingdom | Finsbury | 32-36 City Road | London | EC1Y 2BD | bankofbarodauk.***** | 2017 | $29,580,439 | 118 | Corporation | 99999 | 10826803 |
| 11 | State Bank Of India | USA | New York City | 460 Park Ave | New York | 10022 | statebank.***** | 1977 | $26,441,811 | 134 | Corporation | 99999 | 132535604 |
| 12 | Sbi Canada Bank | Canada | Mississauga | 77 City Centre Dr Suite 106 | Ontario | L5B 1M5 | sbicanada.***** | 1982 | $18,130,230 | 90 | Corporation | 99999 | N/A |
| 13 | Ifs, OOO | Russia | Raduzhnyy | Str. 43 Ofis 1024/3, Mikroraion 1 | Vladimirskaya Oblast' | 628462 | N/A | 2007 | $12,856,590 | 106 | Corporation | 99999 | 81321996 |
| 14 | Gail Global (USA) INC. | USA | Houston | 333 Clay St Ste 3300 | Harris | 77002 | N/A | 2011 | $6,106,242 | 13 | Corporation | 99999 | 0801485639 |
| 15 | Ongc Videsh Atlantic, INC. | USA | Houston | 2200 Post Oak Blvd Ste 1230 | Harris | 77056 | N/A | 2015 | $5,443,805 | 8 | Corporation | 99999 | 0802045881 |
| 16 | Kommercheski Indo Bank, OOO | Russia | Moskva | 16 Ul. Marksistskaya | Moskva | 109147 | N/A | 2003 | $2,802,349 | 17 | Corporation | 99999 | 71649603 |
| 17 | Iocl (USA) INC. | USA | Austin | 800 Brazos St Ste 400 | Travis | 78701 | N/A | 2012 | $2,718,276 | 4 | Corporation | 99999 | 0801663262 |
| 18 | Rus Imperial Grup, OOO | Russia | Tomsk | D. 51a Str. 15, Prospekt Kirova | Tomskaya Oblast' | 634041 | N/A | 2006 | $1,078,107 | 51 | Corporation | 99999 | 95111239 |
| 19 | Yiwu Commodity City (germany) GMBH | Germany | Frankfurt am Main | Mainzer Landstr. 47 | Frankfurt am Main, Stadt | 60329 | ccc-group.***** | 2017 | $737,714 | 2 | Corporation | 99999 | 60313B111172 |
| 20 | Bprl International B.V. | Netherlands | Amsterdam | Gustav Mahlerplein 28 | Noord-holland | 1082 MA | smartmatic.***** | 2008 | $711,656 | 4 | Corporation | 99999 | 34298165 |
| 21 | Redcliffe Holdings LIMITED | Cyprus | Lemesos | Floor 9, Flat 903b,nicolaou Pentadromos Center, Block B, 1 Agi | Lemesos | 3026 | N/A | 2006 | $711,656 | 4 | Corporation | 99999 | HE173575 |
| 22 | Imperial Energy LIMITED | Cyprus | Lefkosia | Flat 202, 32 Falirou | Lefkosia | 1046 | N/A | 2007 | $711,656 | 4 | Corporation | 99999 | HE210298 |
| 23 | Lighthouse Toys LTD | Malta | Il-marsa | A53 Industrial Estate | N/A | HMR15 | N/A | 1967 | $548,028 | 17 | Corporation | 99999 | C 976 |
| 24 | Cnpc Europe And North America LIMITED | Unitedkingdom | Marylebone | Suite S17 Shell Mex House | London | WC2R 0RL | N/A | 2025 | $394,168 | 5 | Corporation | 99999 | 16305199 |
| 25 | Imperial Energy Nord LIMITED | Cyprus | Lemesos | Floor 9, Flat 903b,nicolaou Pentadromos Center, Block B, 1 Agi | Lemesos | 3026 | N/A | 2004 | $392,583 | 3 | Corporation | 99999 | HE151581 |
Showing 25 of 43 companies
Request Free SampleCompanies by Employee Size
- 1-420
- 5-96
- 10-194
- 20-492
- 50-992
- 100-1994
- 200-4991
- 0 or Unknown4
Companies by Revenue Size (in USD)
- 0 or Unknown6
- 1 to 100.0002
- 100.001 to 499.99912
- 500.000 to 999.9995
- 1.000.000 to 4.999.9993
- 5.000.000 to 9.999.9992
- 10.000.000 to 49.999.9997
- 50.000.000 to 99.999.9993
- 100.000.000 to 499.999.9991
- 500.000.000 to 999.999.9992
Global Coverage
Verified Data
Structured Ownerships
Compliance Ready
Data Fields from a Company Group
Each record in our Company Ownership Structure Data includes all group fields in a single Excel or CSV row. You get global headquarter, parent companies, ownership shares, key owners, control type, identifiers, and financial details. Every file includes linkage keys (Group ID, Ultimate Parent ID, Immediate Parent ID) so you can connect related companies and rebuild full ownership structures instantly.
What is Company Ownership Structure Data?
Company Ownership Structure Data shows how companies are connected through corporate groups, parent entities and beneficial owners. It reveals who controls which companies, how they are linked, and where they are headquartered. This information helps organizations understand complex business networks, assess risk, and map ultimate ownership across borders. With data on more than 350 million companies worldwide, we provide the most complete view of corporate hierarchies and global ownership structures.
How We Map Global, National and Local Headquarters
This corporate ownership mapping methodology helps identify the ultimate beneficial owner (UBO), parent-subsidiary relationships, and multi-level corporate hierarchies across global, national, and local levels.
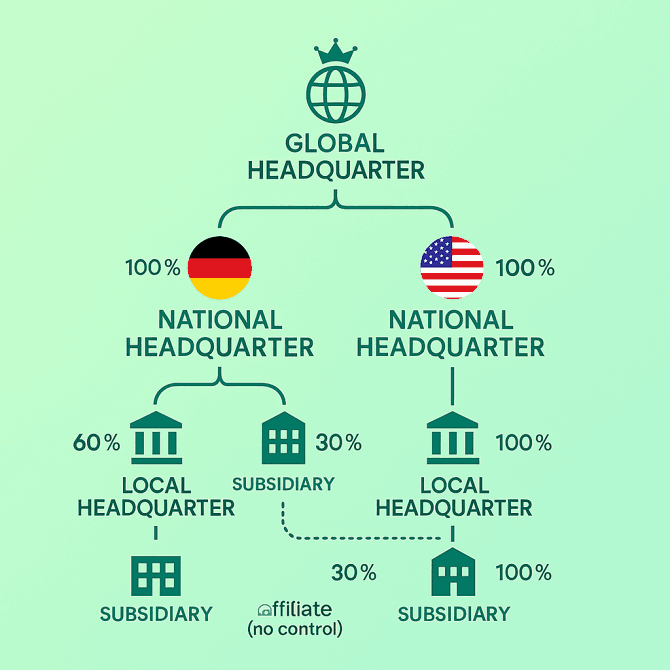
Three levels we use
- Global Headquarter is the top company in the world. It sits above all other entities in the group.
- National Headquarter is the top company within one country. A group can have one National Headquarter per country.
- Local Headquarter manages brands, divisions or branches inside a country. It sits above its own subsidiaries.
How control is shown
Control is based on ownership. When a company owns more than fifty percent of another company it controls it. We show these links as solid lines with a percentage such as one hundred percent or sixty percent. When ownership is less than fifty percent the company is an affiliate and there is no control. We show these links as dotted lines with the percentage such as thirty percent.
Why this matters
This model makes it easy to see the real decision makers in a group. It helps with risk checks and compliance. It helps you find the right parent company for contracts and billing. It also improves analytics because the data sits in the right place in the family tree.
Use Cases
Where Company Group Structures Makes The Difference
Understanding who owns who unlocks a clearer view of the global business landscape. Bold Hierarchies helps teams connect the dots between parent companies, subsidiaries, and beneficial owners — powering sharper decisions across every department.
Business Verification
Identify ultimate owners and verify entities to meet AML, sanctions, and due-diligence requirements.
CRM & Sales
Link related accounts, reveal cross-sell and upsell potential, and target corporate groups more effectively.
Finance & M&A
Map ownership chains during deal sourcing, investment research, and acquisition screening.
Software & AI
Integrate hierarchy data directly into your CRM, AI model, or analytics dashboard via API or bulk delivery.
Supply Chain Mapping
Trace supplier ownership and reveal hidden dependencies within complex global networks.
Before You Request a Sample
Our Company Ownership Structure Data is built for organizations that need visibility into global ownership and control – for CRM enrichment, compliance, analytics, or internal tools. It’s not intended for basic lead generation. Looking for leads? Explore the Bold Platform instead.
- Samples are available only to officially registered companies with an active website.
- Files are delivered in CSV or Excel format.
- Tell us about your use case so we can provide the most relevant sample.
- Need flexible targeting? Use the Bold Platform to build your own list instantly.
Request a quote
Request a tailored company ownership dataset built around your business goals. Our team delivers a quote and free sample within 24 hours.